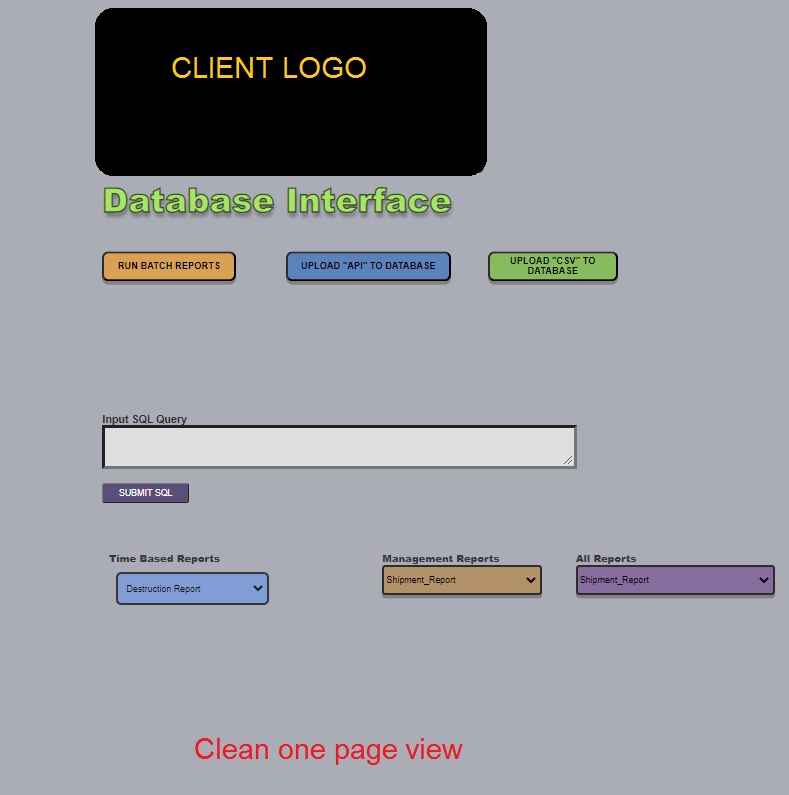
Python App / Database - ( Inventory )
Link :
|
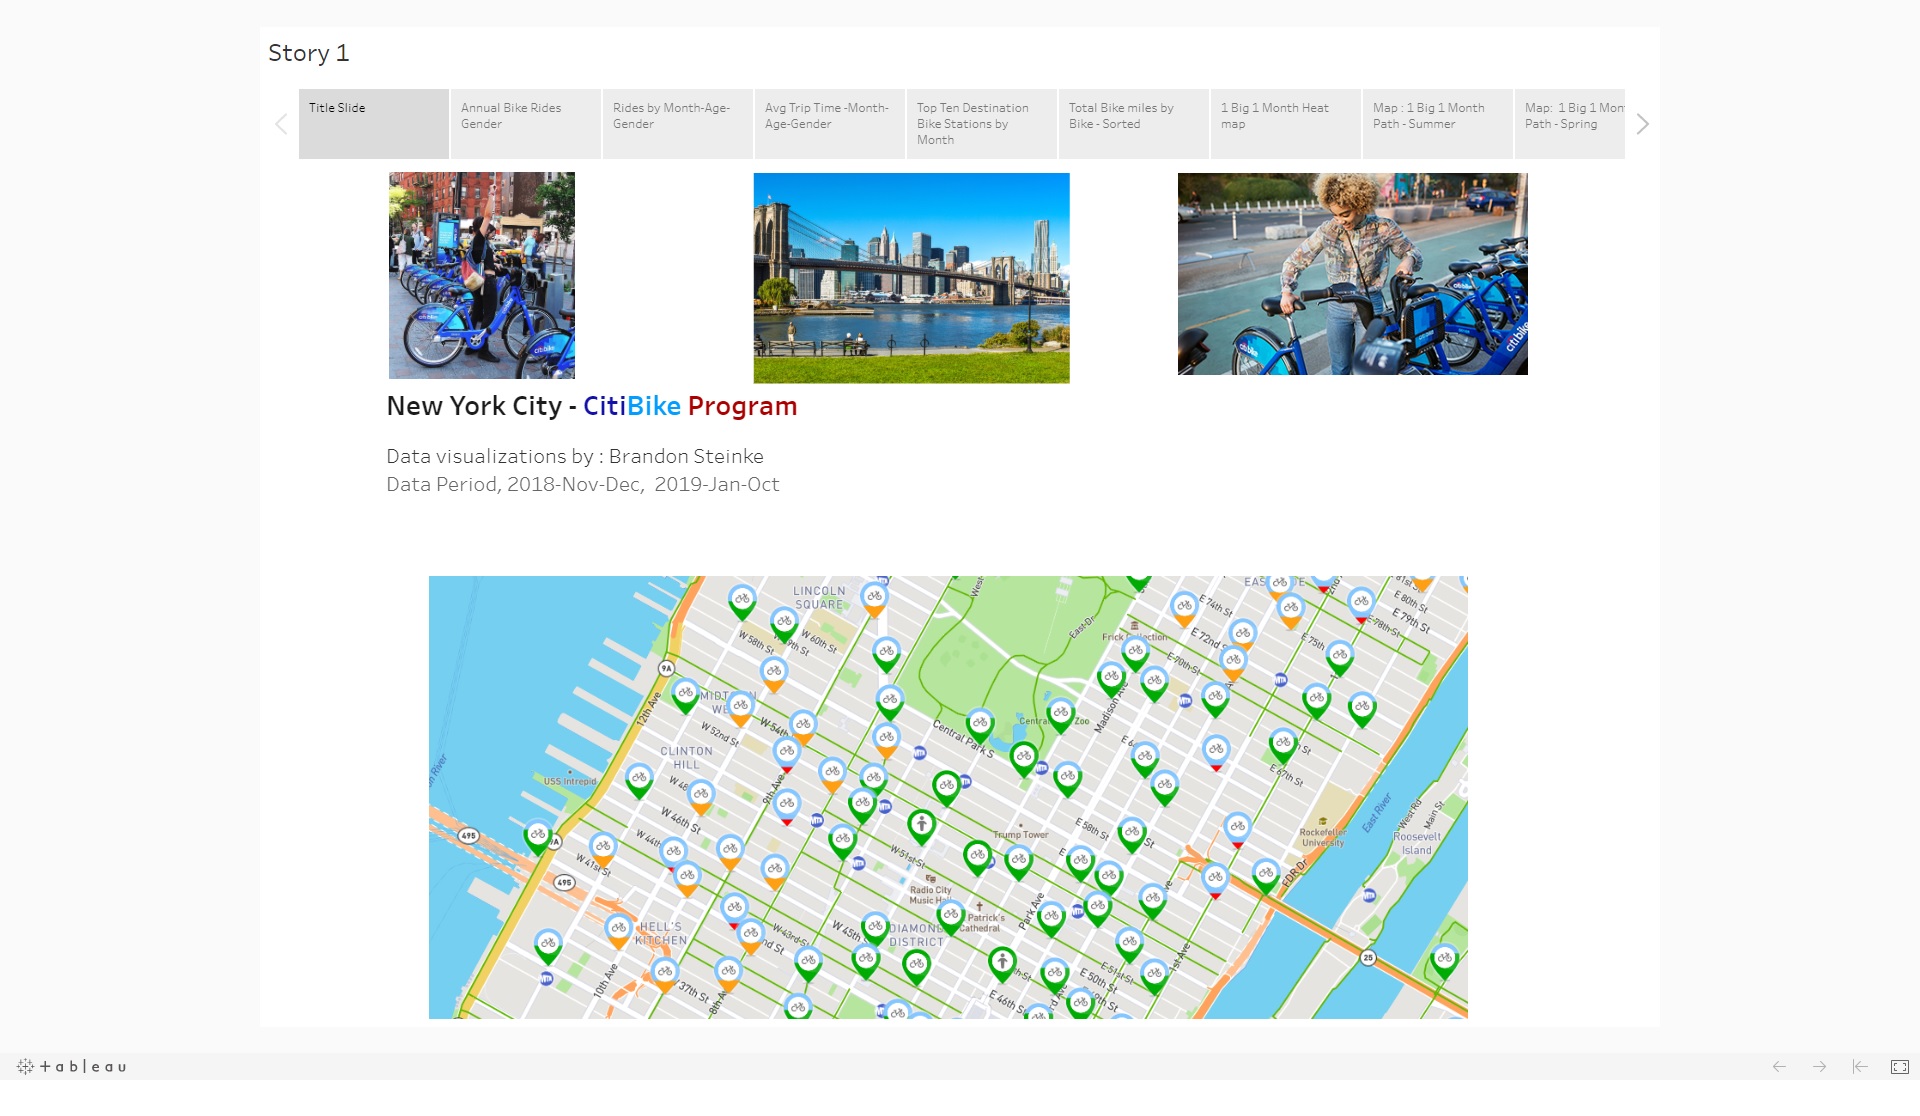
Tableau Analysis - (City Bike Rentals)
Link :
|
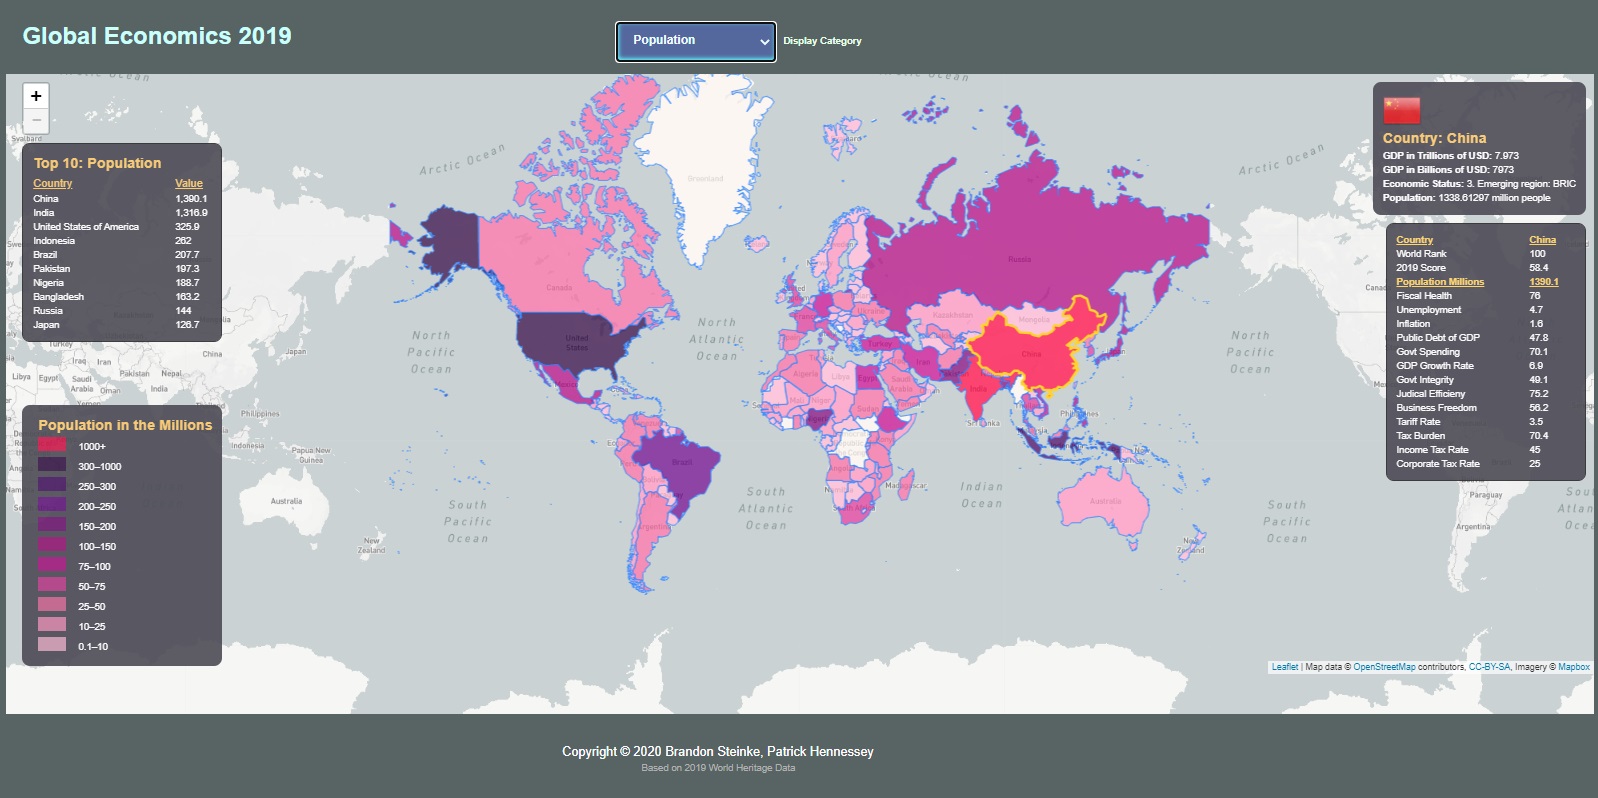
Dashboard / DB - (Economics)
Link:

|
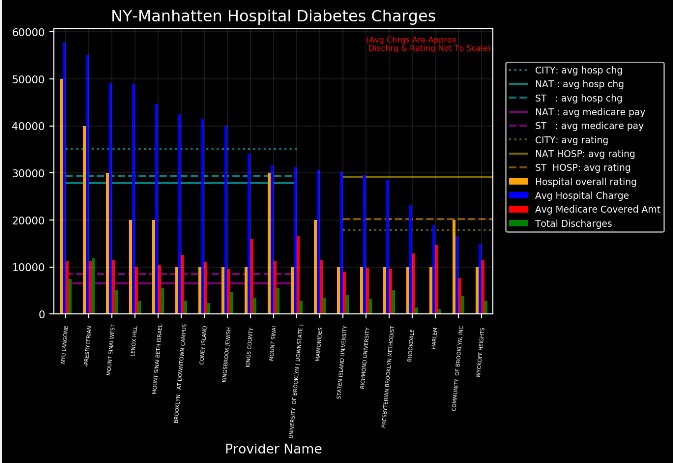
Statistical Analysis - (Health Care Costs)
Link :
|
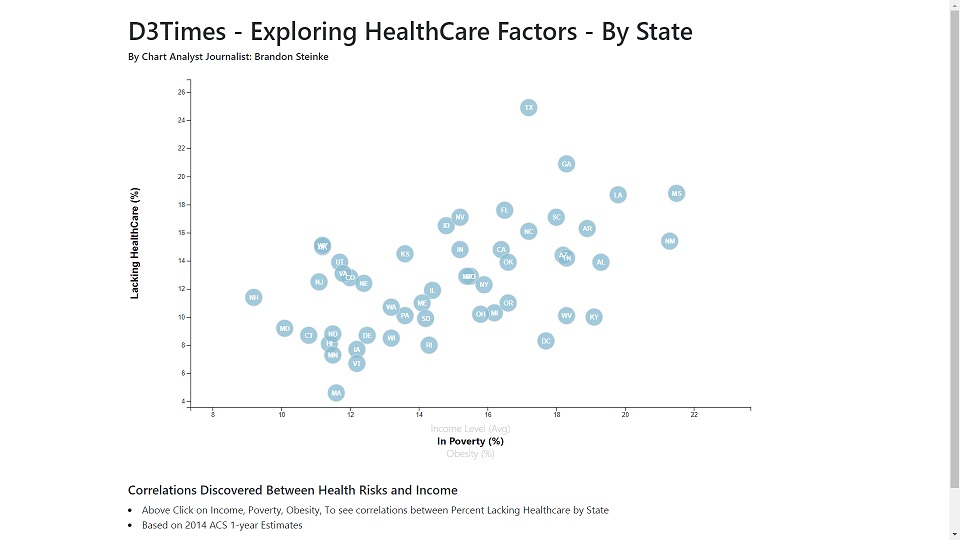
Visualization - (Health Care)
Links :
|
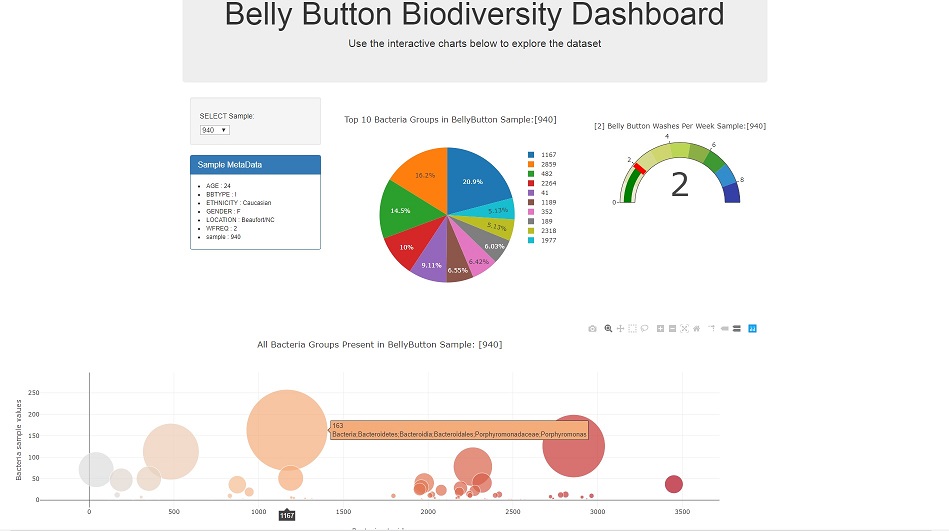
Dashboard - (Bacteria)
Links :
|
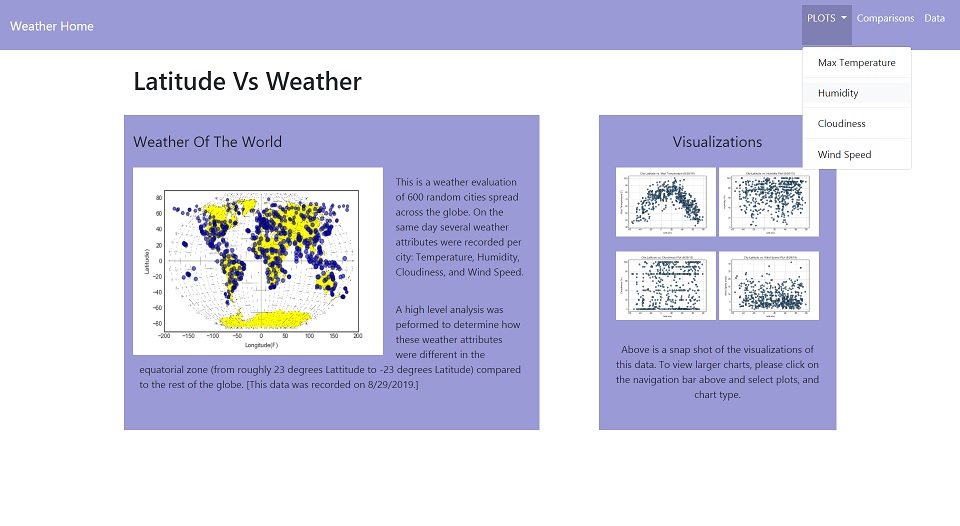
Visualization / API - (Weather)
Links :
|
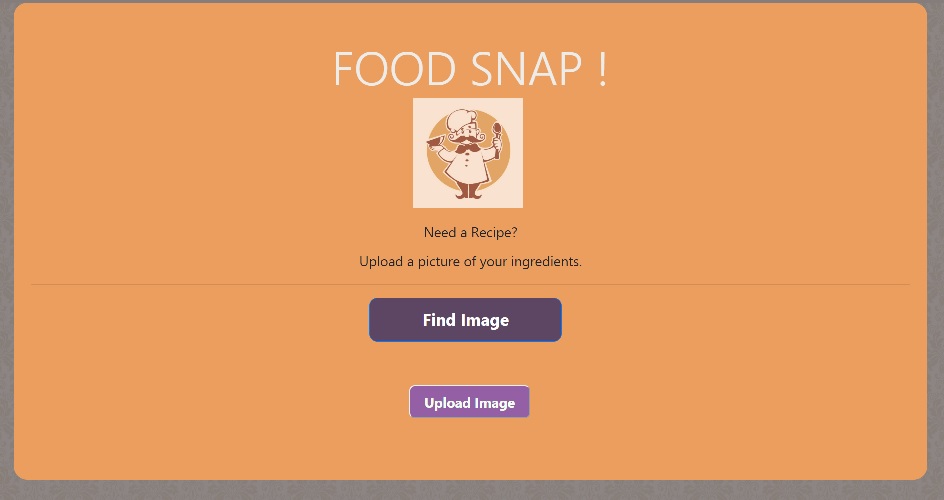
Machine Learning (Image) - Food Snap
Link:
|
Project Zerb - Video Game
Links :


|
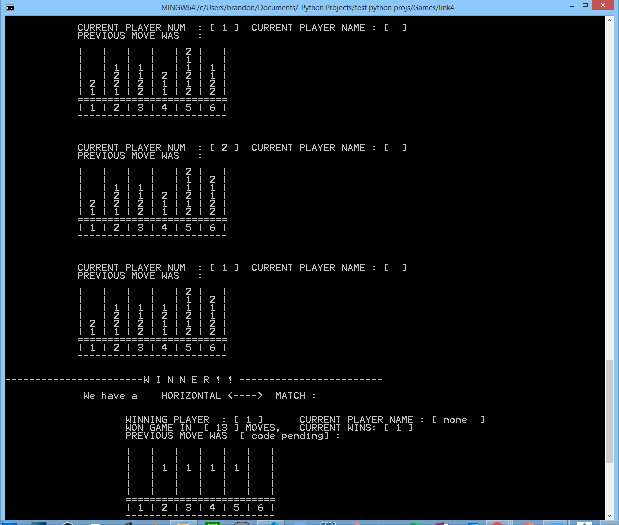
Link 4 - Python Game
Link :
|